
Seismic Attributes as the Framework for Data Integration throughout the Oilfield Life Cycle
Kurt J. Marfurt
The University of Oklahoma
Abstract
While lower in vertical resolution than well log and core data, 3D seismic data provide a more comprehensive image above, below, and at the reservoir than any other data source. For this reason, 3D seismic data and its derivative products form the natural framework for subsequent data integration for both static and dynamic earth models. In the exploration part of the oilfield life cycle, seismic data and seismic attributes image horizons and delineate faults. While interpretation in the exploration stage is necessarily qualitative, it is based on scientific principals of stratigraphy and structural geology. Attributes illuminate architectural elements that help determine the depositional environment, while small faults and flexures help determine the deformation process. In the development part of the oilfield life cycle, the addition of downhole measurements provides a means to become more quantititative. Correlation of image logs and microseismic events with curvature and azimuthal anisotropy help define areas that are more intensely fractured. Well log measures of P-velocity, S-velocity, and density coupled with rock physics data bases and systematics provide the basis for seismic impedance inversion, allowing the interpreter not only to evaluate direct hydrocarbon indicators but also to construct a geocellular model. Seismic data plays a lesser role In the mature part of the oilfield life cycle, where the goal is to extract the remaining oil at minimal expense. Legacy seismic surveys shot when the oil field was young may not contain the resolution needed to best understand subtleties in the mature oil field. Reacquiring seismic data is more common in large offshore reservoirs where significant resources remain. Here, time lapse attribute analysis provides the means to identify by-passed pay, sweep, flow barriers, changes in pressure, and potential geomechanical instabilities.
Mature fields can be reborn. Overlooked deeper and shallower objectives as well as new play concepts reinvigorate oil fields where the acerage is held and the infrastructure is in place. 5D interpolation reinvigorates legacy seismic surveys. In North America, technical innovations including horizontal drilling and hydraulic fracturing may directly target the source rock, or drill tight or highly heterogeneous parts of the reservoir too expensive to produce from vertical wells. Our analysis becomes more statistical, where the experience obtained from tens if not hundreds of wells can be correlated to volumetric attributes. Using core to generate reservoir-specific templates, seismic attributes can be statitically correlated to brittleness, total organic carbon, rate of penetration, and expected ultimate recovery.
In this one day short course, I will illustrate these concepts by example, showing modern workflows based on interactive interpretation and display as well as those aided by machine learning.
Course Duration
One day
Intended Audience
- Seismic interpreters who want to extract more information from their data.
- Seismic processors and imagers who want to learn how their efforts impact subtle stratigraphic and fracture plays.
- Sedimentologists, stratigraphers, and structural geologists who use large 3D seismic volumes to interpret their plays within a regional, basin-wide context.
- Reservoir engineers whose work is based on detailed 3D reservoir models and whose data are used to calibrate indirect measures of reservoir permeability.
- Team leaders who wish to identify advances in machine learning technology that promise improved efficiency and accuracy in the integration of large data volumes.
Prerequisites (Knowledge/Experience/Education Required)
Participants should have a basic understanding of sedimentology and structural geology and familiarity, but not necessarily expertise in 3D seismic interpretation. The accompanying textbook will include mathematical details of volumetric attribute calculation, image processing, and machine learning algorithms. The lecture will focus on fundamental assumptions, algorithm application, and analysis of the results.
Course Outline
- Introduction
- Seismic attributes and what they measure
- Post-migration data conditioning and image enhancement
- The exploration stage of the oil field life cycle
- The development stage of the oil field life cycle
- The mature stage of the oil field life cycle
- The rebirth stage of the oil field life cycle
- Data integration and a profile of the future interpreter
Learner Outcomes
After completing this short course, the participant should be able to
- use attributes to quantify geometric, dynamic, kinematic, statistical, and geomechanical properties of the 3D seismic data volume,
- use 3D visualization and multiattribute crossplots to interactively enhance and isolate geologic features that otherwise might be overlooked,
- use concepts of geomorphology, diagenesis, and tectonic deformation to integrate seismic and well-log data within an appropriate geologic framework,
- use classical statistics and modern machine learning to establish correlations between 3D seismic data, rock properties, and engineering data that then can be employed to predict future rates of penetration, well-completion success, and well-fluid production, and
- use seismic attributes computed from 3D seismic data as the framework for data integration throughout the lifespan of the oil field.
Instructor Biography
 Kurt J. Marfurt has spent 24 years of his career as an academician, first at Columbia University, then later at the University of Houston and the University of Oklahoma. His career also includes 18 years in technology development at Amoco’s Tulsa Research Center working on a wide range of topics including seismic modeling, seismic imaging, VSP analysis, signal analysis, magnetotellurics, basin analysis, seismic stratigraphy, and seismic attributes. At OU, Marfurt leads the Attribute-Assisted Seismic Processing and Interpretation (AASPI) consortium with the goal of developing and calibrating new seismic attributes to aid in seismic processing, seismic interpretation, and data integration using both interactive and machine learning tools. With colleagues, he has received several best paper and best presentation awards on seismic modeling, coherence, curvature, principal component analysis, and brittleness estimation. He is an honorary member of the SEG and in 2019 received the AAPG Robert R. Berg outstanding research award. Marfurt served as the 2006 EAGE/SEG and as the 2018 SEG Distinguished Short Course Instructor. He has taught continuing education short courses for the SEG and AAPG since 2003. From 1984-2013, he has served as either an associate or assistant editor for Geophysics. In 2013 he joined the editorial board of the SEG/AAPG journal Interpretation where he served as the Editor-in-Chief for 2016-2018, and now serves as Deputy Editor-in-Chief for 2019-2021.
 Results of unsupervised multiattribute classification using generative topographic mapping, co-rendered with coherence, over a turbidite system, offshore New Zealand. Input attributes included peak spectral frequency, peak spectral magnitude, curvedness, and GLCM entropy. (After Zhao et al., 2015; data courtesy of New Zealand Petroleum Ministry).

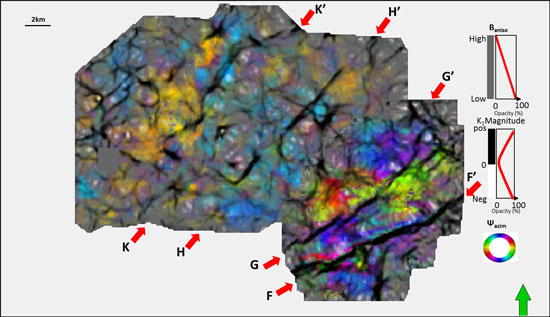
Phantom horizon slices 20 ms above the top Viola limestone through amplitude vs. azimuth (AVAz) anisotropy strike Ψazim modulated by its value Baniso. Most-positive curvature is plotted against a gray scale and shows subtle faults. The survey in the NW has been hydraulically fractured while that in the SE has not. Note the compartmentalization of azimuth in the upper left survey, where curvature acts as fracture barriers. Note the stronger anisotropy (brighter colors) in the SE survey which had not yet been hydraulically fractured. (Image courtesy of Shiguang Guo, OU).